As the largest government agency in the United States, USPS operates on a massive scale, serving virtually every community nationwide. Managing this a vast network requires real-time insight into delivery operations at every level. I was tasked with redesigning a tablet-optimized dashboard to give regional managers a faster, clearer view of carrier performance metrics — and to empower them to drive measurable improvements in service quality.
I led the UX and UI design process from discovery through high-fidelity prototyping. Throughout the project, I leveraged modern AI-assisted tools to accelerate ideation and ensure the final product aligned with USPS’s operational needs, brand identity, and accessibility standards.
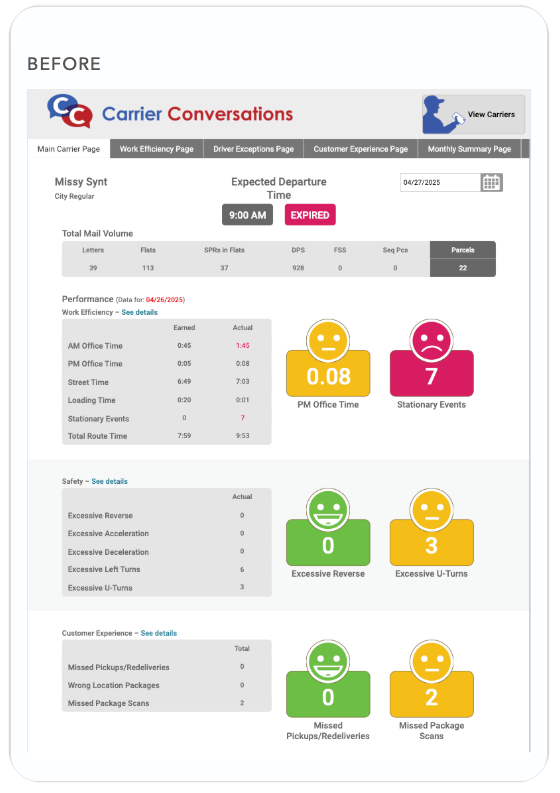
The original dashboard was difficult to navigate, cluttered with dense tables and lacked clear visual hierarchy. Managers struggled to identify urgent issues at a glance, limiting their ability to provide timely feedback to carriers. The redesign needed to surface critical performance data clearly, support rapid decision-making, and remain intuitive even under the demands of daily field operations.
Given the critical nature of USPS operations, I prioritized a minimalist design philosophy from the outset. In the USPS environment where every second matters, clarity and speed are critical. Minimalist layouts — with ample white space, strong typographic hierarchy, and restrained color use — reduce cognitive load, allowing managers to scan, assess, and act without hesitation. A clean, intuitive interface was necessary to improve operational effectiveness across USPS teams.

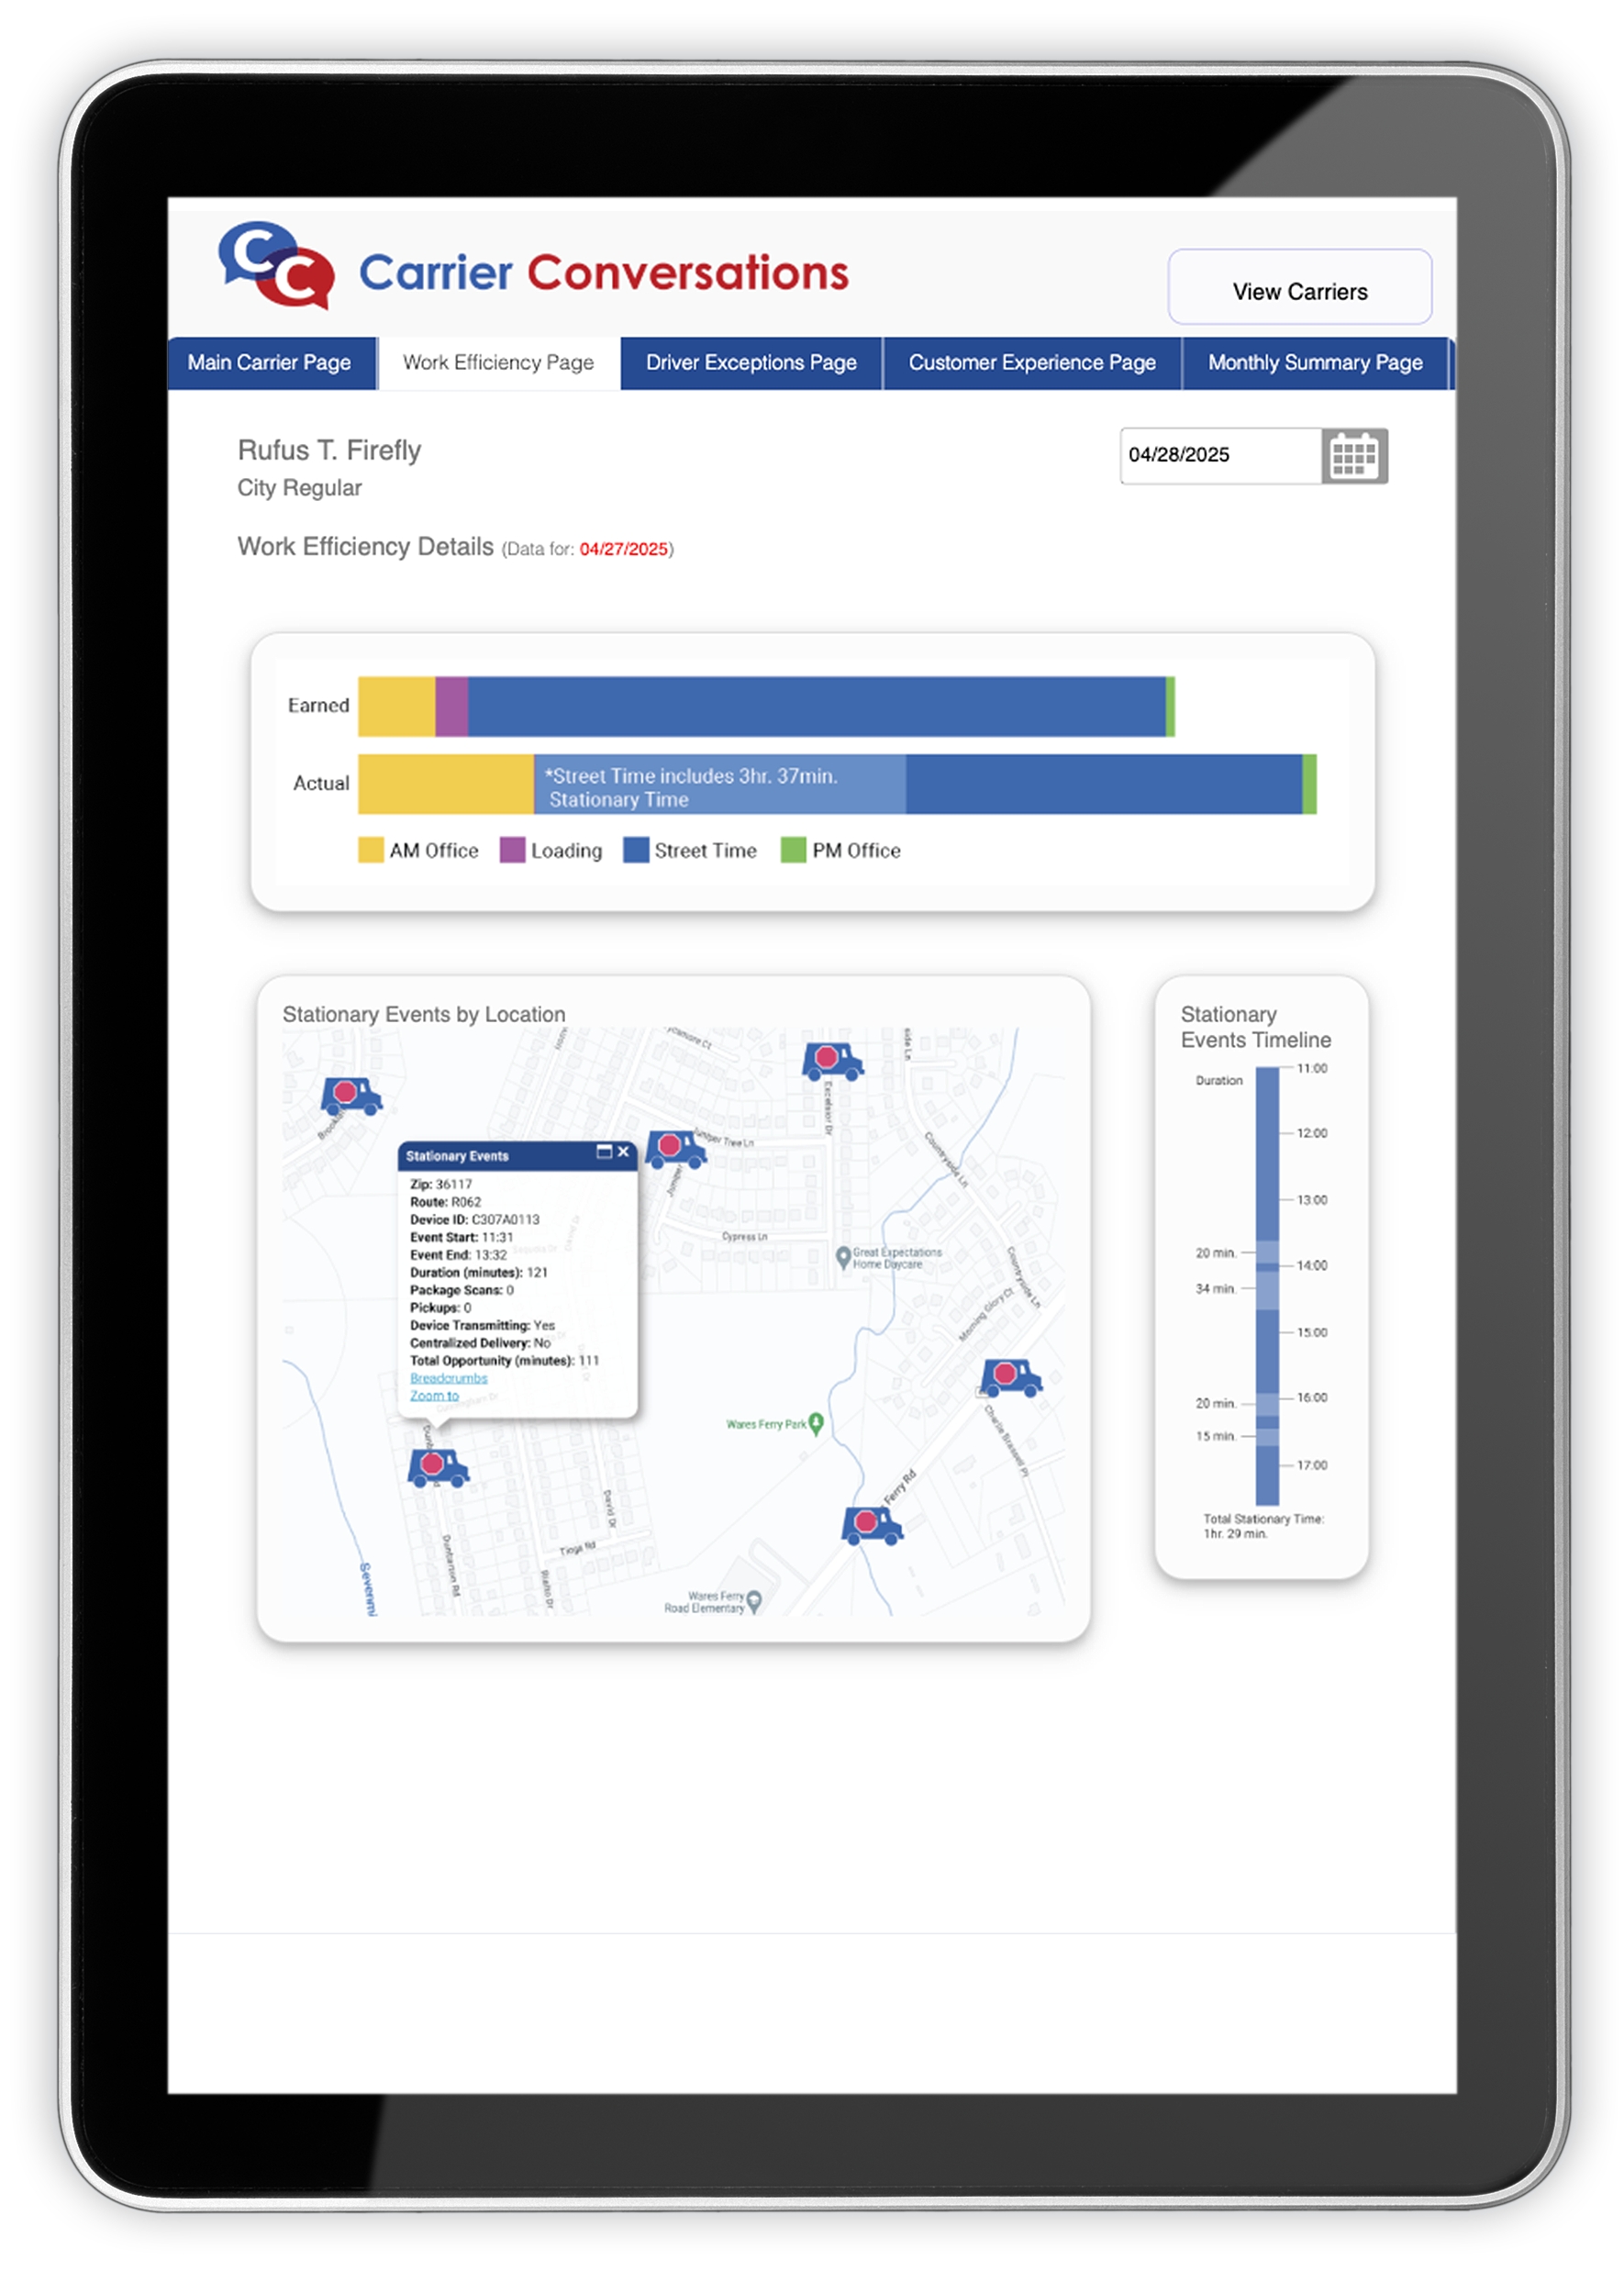
To ground the redesign in real user needs, I conducted a detailed audit of the existing system and interviewed both regional managers and carriers. Through these discussions, I mapped user workflows, pain points, and data priorities. Key insights included the need for real-time comparison to historical metrics, immediate surfacing of outlier performance, and a simplified way to track active delivery issues.
Building on the minimalist framework, I selected the Inter font family for its clean lines, high legibility, and scalability across device sizes. I used AI-powered font pairing inspiration tools such as Fontjoy to validate contemporary, accessible typography pairings.
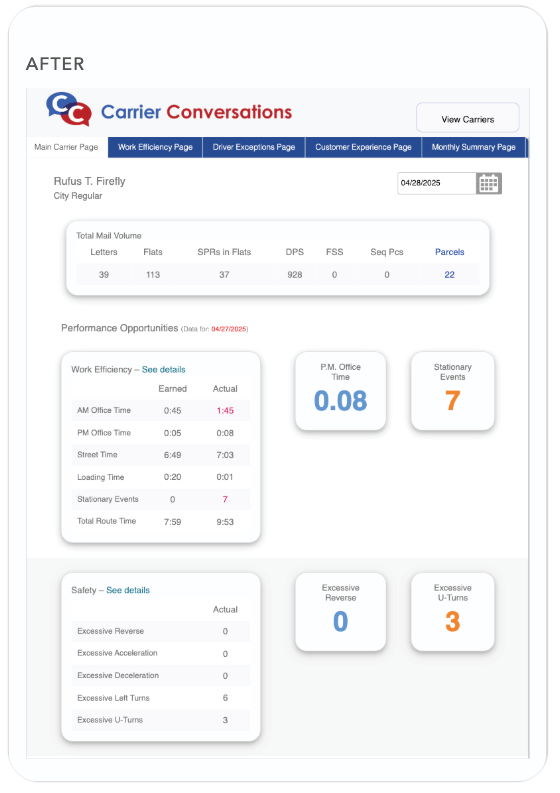
The color palette simplified, and avoided using colors that may not be discernable for users with vision impairments. Unnecessary and possibly off-putting graphics were eliminated to place the emphasis squarely on the metrics.
Visual spacing and grouping reinforced key workflows, making critical information instantly scannable and reducing decision friction for managers on the move.
Using AI-driven platforms like Galileo AI, I quickly explored a range of dashboard structures, focusing on clean information hierarchy and ease of use on tablet screens. Early wireframes emphasized modular KPI cards, intuitive filters, and easily sortable tables. After stakeholder feedback sessions, I refined the layout to balance organizational reporting requirements with field usability demands.
The redesigned dashboard delivered tangible improvements across multiple operational metrics. The app was cleaner, more intuitive and easier to navigate.